Methods
The Reservoir Evaporation API integrates daily gridded weather and reservoir property data into the Penman-based Daily Lake Evaporation Model, enabling the simulation of daily evaporation rates at each relevant reservoir. These rates are then combined with surface area estimates and precipitation data to produce net evaporation rates, volumes, and associated outputs. The integrated data is stored in a geodatabase for secure storage and easy access via a web interface and API.
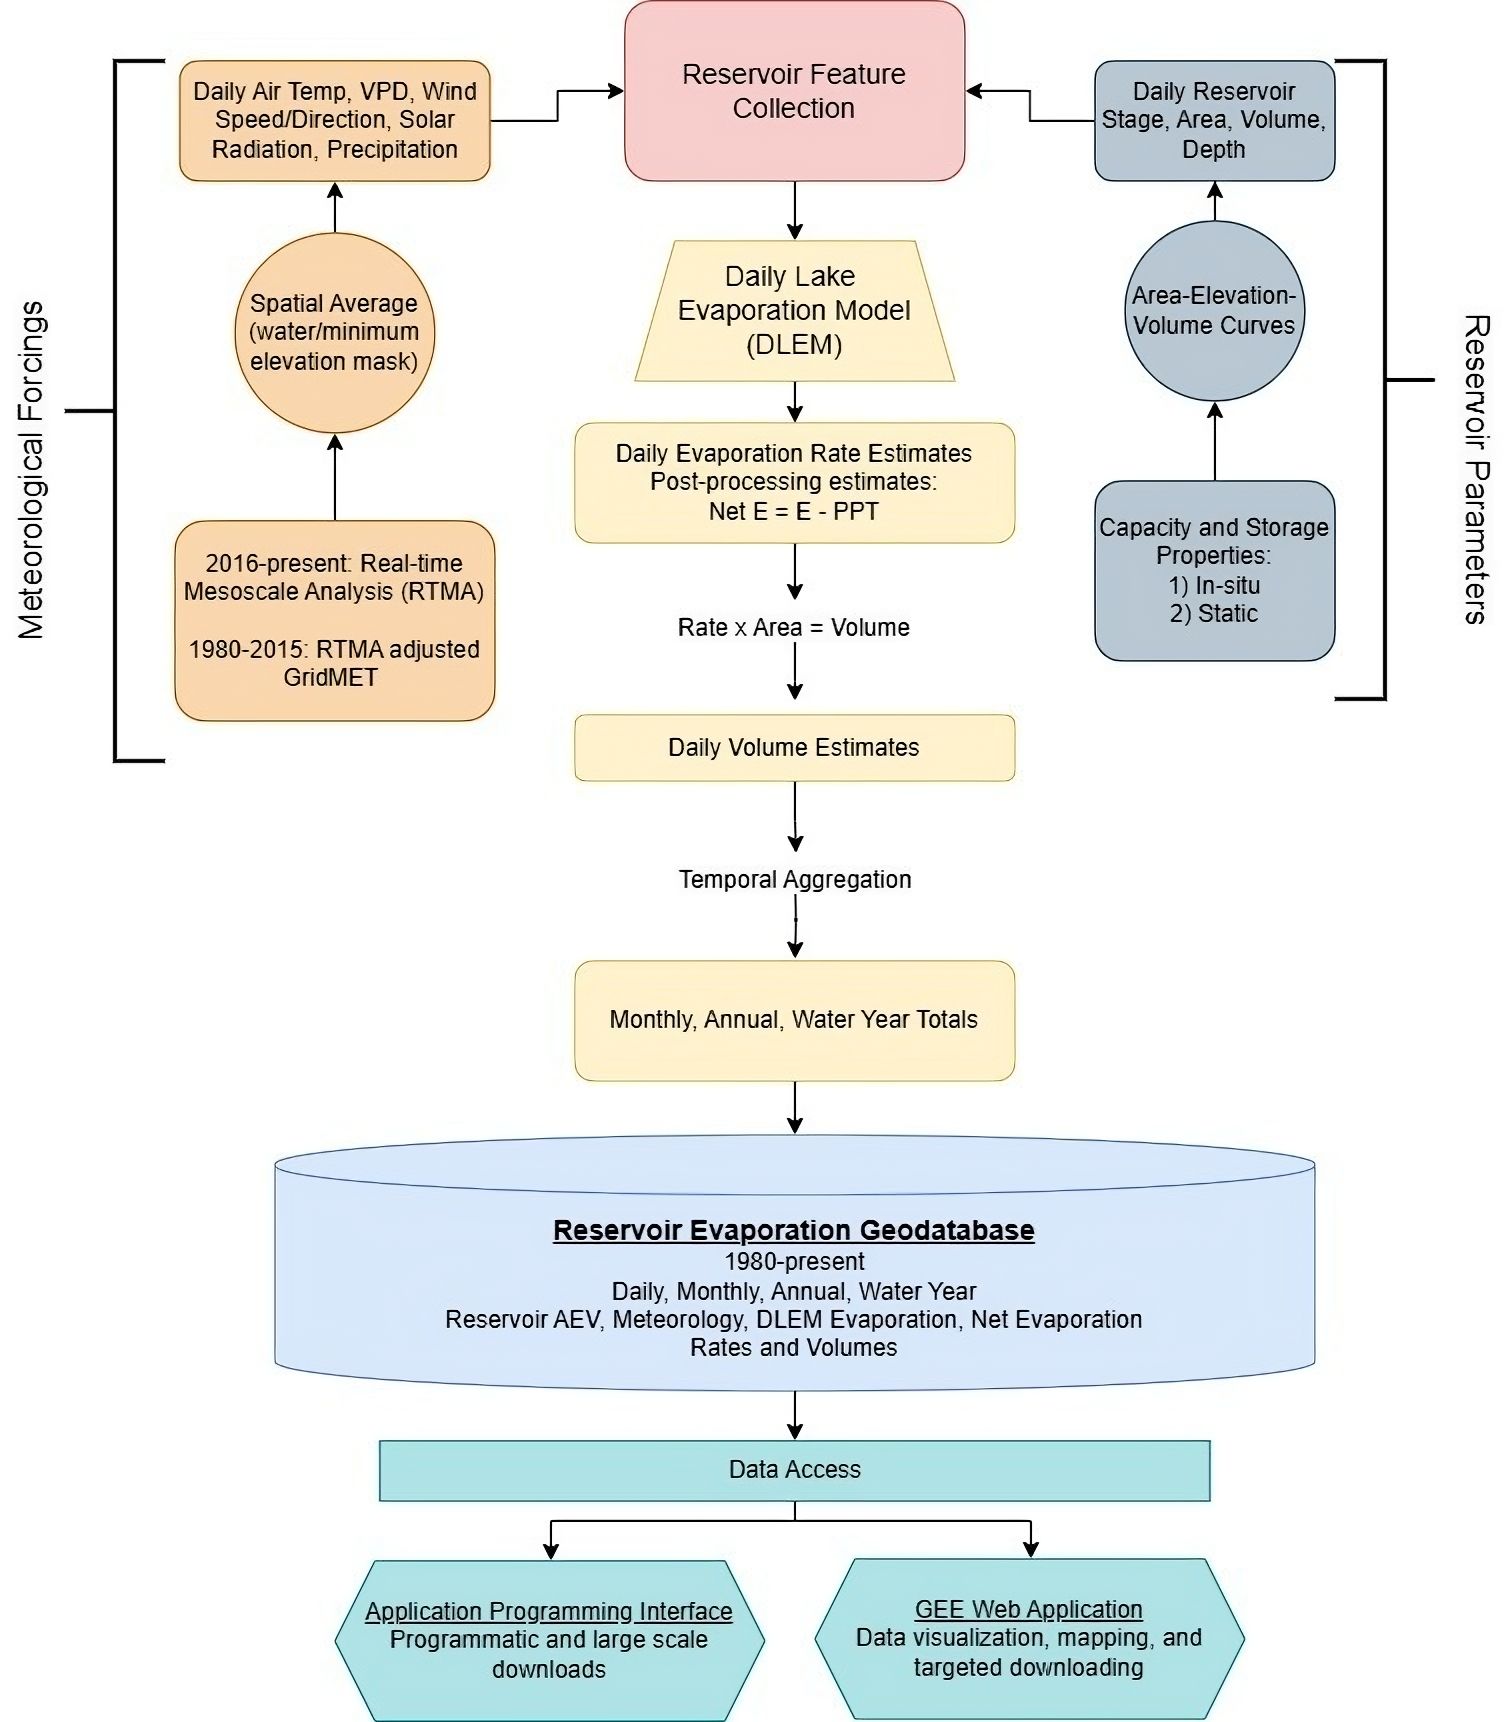
Figure: Conceptual diagram of reservoir evaporation processing pipeline and geodatabase storage and access end points.
Daily Lake Evaporation Model
Reservoir evaporation estimates produced by this project are based on a daily version of Texas A&M Lake Evaporation Model (DLEM) developed by Zhao and Gao (2019) and Zhao et al. (2024). DLEM uses a Penman combination equation along with reservoir fetch and heat storage effects represented. DLEM requires input solar radiation, wind speed and direction, air temperature, vapor pressure deficit, and reservoir area and depth data. Meteorological forcing data is adjusted to over water conditions using wind functions developed by McJannet (2012).
Reservoir heat storage within DLEM is simulated using an equilibrium temperature approach where water column temperature at the current timestep is calculated from water temperature at the current timestep, equilibrium temperature, and a lag time. The equilibrium temperature is defined as the water temperature at which there is no heat exchange between air and water. The lag time is a function of reservoir depth. Inclusion of heat storage adjustments improves evaporation estimates in large, deep-water bodies where a significant amount of radiative energy in the spring goes towards warming the water body rather than fueling evaporation. Conversely, in the fall when the water body is warm and air temperatures are cool, heat storage can increase evaporation rates. Daily evaporation rate estimates are combined with reservoir surface area information to estimate volumetric losses.
Reservoir Depth, Area, and Volumes
Historical and real-time reservoir area, depth, and storage volume information for each of the 247 Reclamation reservoirs was obtained through Python-based queries to four separate data servers: Reclamation’s Hydromet, United States Geological Survey (USGS) National Water Information System (NWIS), Reclamation Information Sharing Environment (RISE), and the California Data Exchange Center (CDEC). Across all online databases, water surface elevation data was the most consistently accessible variable and had significantly fewer quality issues than either reservoir surface area or reservoir volume. Consequently, water surface elevation data was retrieved and used to estimate surface area and volume. After retrieval, an inter-quartile range (IQR) outlier method with a fence threshold of 1.5 (used to scale the IQR) was applied to the historical elevation time series to remove outlier values.
After filtering, a forward fill method was used to fill all missing data (i.e., records that were originally missing and/or records that were filtered out with the IQR method). For example, when no data were available for a select period, the last observed elevation value was assumed for the entire missing period until quality data observations resumed. Surface area and volume data were calculated using available site-specific area-capacity curves gathered from RISE. When multiple area-capacity curves were available for a single reservoir, the most recently developed curve was used to reconstruct surface area and volume values for all dates in the historical record. Average reservoir depth, a required input to DLEM, was then calculated as the ratio of daily reservoir volume to daily reservoir surface area for each day in the historical period. Average reservoir depth values before consistent elevation data are based on maximum reservoir capacity characteristics (e.g., volume and surface area). In the absence of readily accessible data or historical area-elevation-volume curves, a static reservoir depth was assumed based on full pool conditions.
Weather Data
Real-time Mesoscale Analysis
Daily near surface weather conditions were extracted from the RTMA dataset stored within Google’s Earth Engine Data Catalog. RTMA provides hourly estimates of near surface windspeed and direction, temperature, specific humidity, and pressure at 2.5 km resolution (De Pondeca et., al. 2011). Hourly data were aggregated to daily timesteps prior to extraction. Daily RTMA data aggregation start and end at 6 UTC to represent central standard time midnight to midnight day. Data extraction workflows utilized the RTMA water mask combined with reservoir maximum areal extent information to extract meteorological data most representative of average over water conditions for each reservoir (Figure 3). Cell selection for smaller reservoirs with no water masked values was based on minimum cell elevation for all cells intersecting the reservoir’s maximum extent.
Pre-2016 Data
The Google Earth Engine RTMA dataset begins in 2011, however, data coverage prior to 2016 includes numerous gaps and missing values. To extend the evaporation estimate record back to 1980 we incorporated information from the gridMET climate dataset (Abatzoglou, 2013). All evaporation estimates from 2016 forward use RTMA directly, however, estimates prior to 2016 utilize a hybrid meteorological dataset based on direct comparisons of RTMA with gridMET. gridMET provides near surface meteorological estimates at 4km resolution from 1979‒present, however, gridMET does not incorporate buoy-based station data or conditioning for overwater conditions and can overestimate aridity in irrigated and, or wet environments (Huntington, 2011; Abatzoglou, 2013).
Bias correction factors were developed by comparing average monthly conditions from RTMA with gridMET for each 4km gridMET grid cell. Prior to comparison RTMA was resampled to the 4 km gridMET grid using a mean reducer. Monthly ratios of RTMA to gridMET were developed based on 2016-2021 data for windspeed, specific humidity, and solar radiation. Temperature correction factors were developed by subtracting gridMET monthly average minimum and maximum temperature from RTMA. Bias correction factors were then applied to each individual forcing variable on a monthly basis prior to model input. Similar bias correction workflows have been utilized to estimate reference evapotranspiration from gridMET based on comparisons between agricultural weather stations and gridMET (Melton et al., 2021, Volk et al., 2021).
References
Abatzoglou, John T. "Development of gridded surface meteorological data for ecological applications and modelling." International Journal of Climatology 33.1 (2013): 121-131.

De Pondeca, Manuel SFV, et al. "The real-time mesoscale analysis at NOAA’s National Centers for Environmental Prediction: current status and development." Weather and Forecasting 26.5 (2011): 593-612.

McJannet, David L., Ian T. Webster, and Freeman J. Cook. "An area-dependent wind function for estimating open water evaporation using land-based meteorological data." Environmental modelling & software 31 (2012): 76-83.

Melton, Forrest S., et al. "Openet: Filling a critical data gap in water management for the western united states." JAWRA Journal of the American Water Resources Association (2021).

Volk, John, et al. "OpenET Satellite-based ET Intercomparisons with Ground-based Measurements: Phase II Results." AGU Fall Meeting Abstracts. Vol. 2021. 2021.

Zhao, Gang, and Huilin Gao. "Estimating reservoir evaporation losses for the United States: Fusing remote sensing and modeling approaches." Remote Sensing of Environment 226 (2019): 109-124.

Zhao, Bingjie, et al. "Developing a general Daily Lake Evaporation Model and demonstrating its application in the state of Texas." Water Resources Research 60.3 (2024): e2023WR036181.